


Contents
Scroll to:
https://doi.org/10.14341/DM8039
Scroll to:
Background. The main complication of diabetes mellitus is diabetic nephropathy in both types, which is a main reason for renal failure. Echinochrome substance present in sea urchin shells and spines and possesses high antioxidant activity.
Aim. is to evaluate the ability of Ech to suppress the progression of diabetic complication in kidney.
Materials and methods. Thirty-six male Wistar albino rats were divided into two main groups, type 1 diabetes mellitus and type 2 diabetes mellitus. Both groups divided into control, diabetic and echinochrome subgroups. Type 1 diabetes was induced by single dose of streptozotocin (60 mg/kg, i.p), while type 2 was induced by high fat diet for 4 weeks before the injection with streptozotocin (30 mg/kg, i.p). The treated groups were administrated by echinochrome (1mg/kg body weight in 10% DMSO) daily for 4 weeks.
Results. Echinochrome groups showed reduction in the concentrations of glucose, malondialdehyde, urea, uric acid and creatinine. While it caused general increase in glutathione-S-transferase, superoxide dismutase, catalase, glutathione reduced, nitric oxide and creatinine clearance. The histopathological investigation showed clear improvement in the kidney architecture.
Conclusion. Administration of echinochrome improves renal function and ameliorates renal histopathological changes possibly by improvement of glucose metabolism and inhibition of lipid peroxidation process.Soliman A.M., Mohamed A.S., Marie M.S. Echinochrome pigment attenuates diabetic nephropathy in the models of type 1 and type 2 diabetes. Diabetes mellitus. 2016;19(6):464-470. (In Russ.) https://doi.org/10.14341/DM8039
The prevalence of diabetes mellitus (DM) has risen rapidly in the past few years [1]. DM is a main cause of morbidity and mortality worldwide [2]. It is considering a metabolic disorder characterized by hyperglycemia, which caused by the deficiency in insulin secretion within type 1 diabetes (T1DM), and it is the main a feature of uncontrolled type 2 diabetes (T2DM) along with insulin resistance. Many complications accompanied uncontrolled diabetes include vasculopathy, cardiomyopathy, nephropathy, neuropathy and retinopathy.
A major complication of DM is diabetic nephropathy (DN) in both type 1 and type 2, which is a main cause of end stage renal disease [3]. DN development process is associated with inflammation, renal hypertrophy, and fibrosis [1]. DM stimulates significant change in renal architecture, such as severe reduction of glomerular tufts and increasing of Bowman’s spaces. Although a number of factors have been implicated in the pathogenesis of DN include oxidative stress [4].
Chronic hyperglycemia activates production of reactive oxygen species (ROS) through multiple pathways, which collectively contribute to the pathogenesis of DN [5]. The effect of ROS includes damage of cell membrane; inactivate endogenous antioxidants, lipid and carbohydrate. Thus, prevention of oxidative stress is the key factor for treatment of DN.
Streptozotocin (STZ) is well known for its selective beta cell cytotoxicity, which induces DM in rats [6]. The animal model of high-fat diet (HFD) which combined with low dose STZ induced diabetes manifests many characteristics of human type 2 diabetes, such as hyperglycemia, hyperlipemia and lack of insulin secretion [1].
Echinochrome (Ech) is pigment extracted from sea urchins which have antioxidant and hypoglycemic activities [7]. The aim of the study is to evaluate the ability of Ech to suppress the progression of diabetic complication in kidney
Chemicals and reagents
Streptozotocin (STZ), sodium pentobarbital and dimethyl sulfoxide (DMSO) were purchased from Sigma-Aldrich (St. Louis, MO, USA). Biochemical kits were purchased from the Biodiagnistic Company (El Moror St, Dokki, EGY).
Sea urchin collection
Sea urchins (Paracentrotus lividus) were collected from the Mediterranean coast of Alexandria (Egypt) and transported to the laboratory packed in ice. The samples were thoroughly washed with sea water to remove sand and overgrowing organisms at the collection site and transported to the laboratory. The collected specimens were immediately shade dried.
Echinochrome (Ech) extraction
Pigments in the shells and spines were isolated by the Amarowicz method with slight modifications [8]. After removal of the internal organs, the shells and spines were washed with a stream of cold water, air-dried at 4°C for 2 days in the dark and then were grounded. The powders (5 g) were dissolved by gradually adding 10 ml of 6 M HCl. The pigments in the solution were extracted 3 times with the same volume of diethyl ether. The ether layer collected was washed with 5% NaCl until the acid was almost removed. The ether solution including the pigments was dried over anhydrous sodium sulfate and the solvent was evaporated under reduced pressure. The extract including the polyhydroxylated naphthoquinone pigment was stored at -30°C in the dark.
Experimental animals
Male albino Wistar rats (Rattus norvegicus) weighing 140 ± 10 gm for T1DM and 80 ± 10 gm for T2DM were used in this study. The rats were obtained from the National Research Center (NRC, Dokki, Giza). Rats were housed in a temperature and humidity controlled environment and given food and water ad libitum.
Ethical consideration and field study
Experimental protocols and procedures used in this study were approved by the Cairo University, Faculty of Science, Institutional Animal Care and Use Committee (IACUC) (Egypt) (CUFS/F/33/14). All the experimental procedures were carried out in accordance with international guidelines for the care and use of laboratory animals.
Induction of type 1 diabetes mellitus (T1DM)
All rats were starved for 12 hrs before the experiment, but were allowed free access to water. T1DM was induced by intraperitoneal injection of 60 mg/kg of STZ dissolved in 0.1mol/l sodium citrate buffer at pH 4.5. Blood glucose levels were measured 72 hr after injection of STZ. Rats were starved, but had access to drinking water for 6 hr before blood glucose measurement. Fasting plasma glucose concentrations ≥ 300 mg/100ml were considered diabetic type 1 in this experiment.
Induction of type 2 diabetes mellitus (T2DM)
The rats were fed a high fat diet (HFD) with energy of 5.3 kcal/g, comprising 60% calories from fat, 35% from protein and 5% from carbohydrate. After 4 weeks the rats injected intraperitoneally by a single dose of prepared solution of STZ (30 mg/kg dissolved in 0.1mol/l sodium citrate buffer at pH 4.5). After 72 hours, fasting plasma glucose concentrations ≥ 300 mg/100 ml were considered diabetic type 2 in this experiment.
Experimental design
After one week of acclimatization, 36 rats were assigned into two main groups; T1DM group (18 rats) and T2DM group (18 rats).
T1DM rats group divided into 3 subgroups (6 rats/subgroup):
Control subgroup: After a single dose of citrate buffer (0.1mol/l, i.p), the rats received 1ml (10% DMSO, orally) daily for 4 weeks.
Diabetic subgroup: After a single dose of STZ (60 mg/kg, i.p), the rats received 1ml (10% DMSO, orally) daily for 4 weeks.
Ech subgroup: After a single dose of STZ (60 mg/kg, i.p), the rats received 1ml Ech (1mg/kg body weight in 10% DMSO, orally) [9] daily for 4 weeks.
T2DM group divided also into 3 subgroups (6 rats/subgroup):
Control subgroup: After 4 weeks of normal diets feeding, the rats injected with single dose of citrate buffer (0.1mol/l, i.p) then received 1ml of (10% DMSO, orally) daily for 4 weeks.
Diabetic subgroup: After 4 weeks of HFD feeding, the rats injected with single dose of STZ (30 mg/kg, i.p) then received 1ml of (10% DMSO, orally) daily for 4 weeks.
Ech subgroup: After 4 weeks of HFD feeding, the rats injected with single dose of STZ (30 mg/kg, i.p) then received 1ml Ech (1mg/kg in 10% DMSO, orally) daily for 4 weeks.
Animal handling and specimen collection
After the end of all experiments, the rats were fully anesthetized with 3% sodium pentobarbital, and the chest was opened. A needle was inserted through the diaphragm and into the heart. Negative pressure was gently applied once the heart had been punctured, and the needle was repositioned as required until blood flowed into the syringe. The blood collected from the rats was separated by centrifugation (3000 rpm, 15 min) to obtain sera which were stored at -80°C for the biochemical measurements. The 24 hr (before killing) urine was collected while rats were housed in metabolism cages.
Kidney was removed and immediately blotted using filter paper to remove traces of blood. Then it suspended in 10% formal saline for fixation preparatory to histopathological examination.
Histopathological investigation
The fixed kidney was washed, dehydrated, and embedded in paraffin wax. They were sectioned at a thickness of 4-5 µm and stained with hematoxylin and eosin (H&E) as routine procedures for histopathological examination.
Biochemical analyses:
The serum glucose was estimated by the method of Freund et al [10], serum and urine creatinine was estimated by the method of Schirmeister [11] urea [12] and uric acid [13] according to the manufacturer's instructions using Bio-diagnostic kits (Giza, Egypt).
MDA level is an index of lipid peroxidation and it was estimated by Ohkawa [14], glutathione reduced (GSH) [15], nitric oxide (NO) [16], glutathione-S-transferase (GST) [17], superoxide dismutase (SOD) [18] and catalase [19] were determined in the kidney homogenate supernatant according to the manufactures instructions using Bio-diagnostic kits (Giza, Egypt).
Statistical analysis
Values were expressed as means ±SE. The comparisons within groups were evaluated utilizing one way analysis of variance (ANOVA) with Duncan post hoc test was used to compare the group means and p < 0.05 was considered statistically significant. SPSS, for Windows (version 20) was used for the statistical analysis.
According to the data represented in table (1), the serum glucose concentration increased significantly (P<0.05) in diabetic rats, as compared to corresponding control groups. While, a significant decrease (P<0.05) was recorded in serum glucose concentration of Ech treated rats, as compared to corresponding diabetic groups (Table 1).
Table 1. The effect of Ech on blood glucose (mg/dl) of diabetic male rats
Parameter | Diabetes type | Groups | ||
Control | Diabetes | Ech | ||
Bood glucose (mg/dl) | T1DM | 91.83±7.14a | 370.67±20.7c | 176.00±14.7b |
T2DM | 109.50±3.00a | 317.67±4.20c | 167.17±22.7b | |
The represented data in table (2) showed significant increase (P <0.05) in urine volume, creatinine, urea and uric acid concentrations within the diabetic rats as compared to the corresponding control groups. After 4 weeks of Ech treatment a significant decrease (P<0.05) in urine volume, creatinine, urea and uric acid concentrations was observed as compared to the corresponding diabetic groups (Table 2).
Table 2. The effect of Ech on kidney function parameters of diabetic male rats in urine
Parameter | Diabetes type | Groups | ||
Control | Diabetes | Ech | ||
Urine Volume (ml/24hr) | T1DM | 8.75±0.04a | 45.17±0.10c | 19.75±0.16b |
T2DM | 9.25±0.16a | 36.17±0.24c | 20.33±0.14b | |
Urine uric acid(mg/dl) | T1DM | 82.98±2.34a | 510.05±4.03c | 241.58±3.04b |
T2DM | 98.32±2.25a | 320.67±3.77c | 193.33±3.04b | |
Urine urea (g/dl) | T1DM | 160.33±0.65a | 540.48±3.79b | 170.53±0.11a |
T2DM | 140.50±0.12a | 310.80±0.55c | 200.28±0.39b | |
Urine creatinine(mg/dl) | T1DM | 0.82±0.00a | 6.73±0.24c | 2.03±0.02b |
T2DM | 0.87±0.01a | 1.45±0.00 | 1.28±0.02b | |
Note: Values are given as mean±SE for 6 rats in each group. Each value not sharing a common letter superscript is significantly different (P<0.05).
Table (3) revealed that T1DM and T2DM rats showed a significant increase (P < 0.05) in serum creatinine, urea and uric acid concentrations as compared to the corresponding control groups. However creatinine clearance showed a significant decrease (P <0.05) in both types.
On the other hand, Ech-treated groups showed a significant decrease (P < 0.05) in serum creatinine, urea and uric acid concentrations as compared to the corresponding diabetic groups. While creatinine clearance showed significant increase (P <0.05) in both types of the treated groups (Table 3).
Table 3. The effect of Ech on kidney function parameters of diabetic male rats in serum
Parameter | Diabetes type | Groups | ||
Control | Diabetes | Ech | ||
Serum uric acid(mg/dl) | T1DM | 1.46±0.01 | 2.03±0.01c | 1.81±0.03ab |
T2DM | 4.23±0.02ab | 6.24±0.01c | 4.50±0.01ab | |
Serum urea(g/dl) | T1DM | 22.07±0.29a | 47.07±0.75c | 27.83±0.71ab |
T2DM | 26.07±0.33ab | 45.73±0.69c | 30.50±0.69ab | |
Serum creatinine(mg/dl) | T1DM | 1.86±0.07a | 3.29±0.12e | 2.09±0.02bc |
T2DM | 1.74±0.04a | 2.77±0.03d | 2.42±0.01c | |
Creatinine clearance(ml/min) | T1DM | 8.00±0.36a | 3.83±0.03e | 5.00±0.10b |
T2DM | 5.05±0.23a | 0.78±0.04d | 3.47±0.17c | |
Note: Values are given as mean±SE for 6 rats in each group. Each value not sharing a common letter superscript is significantly different (P<0.05).
The represented data in table (4) showed general decreases in GST, SOD, CAT activates and concentrations of GSH and NO in both types of diabetic rats as compared to the corresponding control groups. However MDA concentration was increased significantly (P <0.05). After 4 weeks of Ech treatment there is general increase in GST, SOD, CAT activates and concentrations of GSH and NO rats as compared to the corresponding diabetic groups. While MDA concentration decreased significantly (P <0.05).
Table 4. The effect of Ech on kidney oxidative stress parameters
Parameter | Diabetes type | Groups | ||
Control | Diabetes | Ech | ||
MDA(nmol/g. tissue) | T1DM | 7.29±0.10a | 10.60±0.10b | 8.02±0.06a |
T2DM | 6.34±0.11a | 9.22±0.09b | 7.14±0.09a | |
GSH(mg/ g. tissue) | T1DM | 26.20±0.28b | 21.13±0.16a | 24.13±0.21b |
T2DM | 23.90±0.14b | 20.60±0.09a | 25.17±0.23b | |
NO(μmol/L) | T1DM | 27.80±0.16b | 23.60±0.07a | 27.40±0.35b |
T2DM | 25.40±0.33a | 23.60±0.27a | 35.00±0.19b | |
GST(U/ g. tissue) | T1DM | 4.20±0.02a | 3.76±0.04a | 5.05±0.09c |
T2DM | 4.38±0.08ab | 4.15±0.03a | 4.85±0.07b | |
SOD(U/ g. tissue) | T1DM | 768.75±6.56b | 637.50±18.47a | 750.00±4.07b |
T2DM | 878.32±2.12a | 796.88±5.75a | 835.63±2.68a | |
CAT(U/ g. tissue) | T1DM | 1.66±0.01a | 1.43±0.03a | 1.49±0.02a |
T2DM | 1.89±0.01b | 1.53±0.02a | 1.80±0.03ab | |
Note: Values are given as mean±SE for 6 rats in each group. Each value not sharing a common letter superscript is significantly different (P<0.05).
Histopathological investigation of kidney
Microscopic examination of the control kidney sections showed normal histoarchitecture with normal glomerulus and Bowman’s capsule (Fig. 1 A,B). On the other hand, the histopathological study of kidney of type 1 and type 2 diabetic rats showed severe degeneration in glomerulus with deformed renal tissue architecture (Fig. 1 C,D). Whereas the treatment with Ech caused marked regeneration in glomerulus and Bowman’s capsule with normal renal tissue architecture (Fig. 1 E,F).
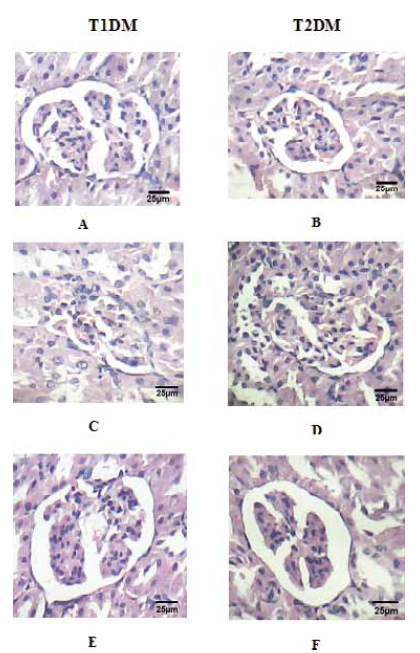
Figure 1: Photomicrograph of hematoxylin and eosin stained kidney sections from (A&B) control rats; (C&D) diabetic rats and (E&F) Ech-treated rats (H&E × 400).
The morphometric data represented that, renal corpuscle, glomerulus and tubular areas of the diabetic rats were increased significantly as compared to control rats (Table 5). Also, abundant mesangial cells were present in the glomerulus of diabetic rats. On the other hand, Ech-treated groups showed reduction in renal corpuscle, glomerulus and tubular areas as long as mesangial cells number as compared to diabetic rats (Table 5).
Table 5. Effect of Ech on morphometric parameters of diabetic male rats
Parameter | Diabetes type | Groups | ||
Control | Diabetes | Ech | ||
Renal corpuscle area (µm2) | T1DM | 10346±145a | 17110±178b | 12493±199a |
T2DM | 8918±155a | 12767±188c | 9620±111b | |
Glomerulus area (µm2) | T1DM | 5917±80a | 7904±100c | 6999±90b |
T2DM | 4172±144a | 7043±90c | 4886±110b | |
Distal tubule area (µm2) | T1DM | 114±20a | 661±70c | 463±64b |
T2DM | 383±50a | 528±71b | 464±40a | |
Proximal tubule area (µm2) | T1DM | 222±55a | 643±99b | 223±85a |
T2DM | 210±30a | 467±68b | 229±49a | |
Number of cells/glomerulus | T1DM | 60±4a | 76±8b | 66±3a |
T2DM | 43±3a | 64±6b | 48±2a | |
Note: the morphometric study was performed in 3 µm thick renal sections stained with hematoxylin and eosin. Fifty glomeruli were analyzed per rat.
Diabetes mellitus (DM) is characterized by absolute or relative deficiencies in insulin secretion, insulin action or both. Diabetic nephropathy (DN) model was established by the significant increase in serum and urine urea, uric acid and creatinine in addition to the significant decrease in creatinine clearance in type 1 diabetes (T1DM) and type 2 diabetes (T2DM) groups. The biochemical changes were confirmed with a histopathological investigation, which detected a marked damage in renal structure showing congestion and severe degeneration in tubular and glomerulus. The most common features of vascular lesions in diabetic mellitus are renal glomerular degeneration along with tubular and interstitial abnormalities [20]. Distal and Proximal tubule areas were found to be significantly higher in the diabetic rats which may indicate proliferation and hypertrophy in the glomerular and tubular regions. The hyperglycemia condition induce proliferation or hypertrophy in renal structures especially in the glomerular mesangium [21].In addition the high glucose level lead to increase number of glomerular mesangial cells and interstitial alterations [22].Increased the areas renal corpuscle and glomerulus may due to fill the urinary space by glomerular capillaries causing sever reduction in the capsular space [23].
The current investigation revealed that, induction of diabetes resulted in elevation of serum and urine creatinine concentration whereas creatinine clearance decreased. High levels of creatinine indicate several disturbances in kidney [24]. In addition, this increase in serum creatinine may be due to the hepatic damage, which evolved into a stage with features of hepatorenal syndrome [25]. Furthermore, decrease creatinine clearance reflecting kidney function impairment in diabetic patient.
The most frequently determined clinical indices for estimating renal function depends upon concentration of urea in the serum. The current investigation revealed that, induction of diabetes resulted in elevation of serum and urine urea concentration. The pathogenesis of diabetic nephropathy are related to chronic hyperglycemia and hemodynamic alterations in renal microcirculation and structural changes in glomerulus as evidenced by the significant elevation in urea level [26].
Negative nitrogen balance is manifested in diabetic rats associated with enhanced proteolysis in muscle and other tissues. Impaired balance of nitrogen coupled with lowered protein synthesis leads to increased concentrations of urea indicates progressive renal damage in diabetic rats [27].
Hyperuricemia is a common finding in patients with metabolic syndrome or its components, such as central obesity and hypertriglyceridemia [28]. Also, increase serum uric acid levels were associated with elevated levels of serum markers of hepatic necroinflammation (ALAT and GGT) and it might be a risk factor for the incidence of chronic liver disease level [29].In addition, an increase in uric acid could relate to oxidative damage [30].
Oxidative stress plays an important role in the development and progression of DN [31]. Excessive oxidative stress in the vascular and cellular tissue can lead to dysfunction of endothelial cell [3]. Thus, DM is more susceptible to kidney injuries and reduction of kidney function. In the present study the oxidative stress condition was established in the diabetic groups by the increase production of malondialdehyde (MDA) and the deficiency in the anti-oxidant system includes glutathione reduced (GSH), glutathione-S-transferase (GST), superoxide dismutase (SOD) and catalase (CAT). Hyperglycemia causes the production of reactive oxygen species (ROS), leads to reduction-oxidation imbalance, which resulting in oxidative stress condition [5]. Oral administration of Ech caused significant decrease in kidney MDA levels and significant increase in the antioxidant system of the diabetic rats.
Nitric oxide (NO) plays numerous physiological functions in the kidney, including control of renal and glomerular hemodynamics [32]. NO concentration decreased significantly in both diabetic groups. This decrease contributes in the chronic kidney disease [32]. Many experimental and clinical evidences mention that, renal nitric oxide synthase (NOS) expression and activity are increased at early diabetes; however, they are decreased at prolonged diabetes leading to vascular NO deficiency, which may induce the progression of DN [33].
On the other hand, NO concentration increased in Ech-treated groups. This increase related to the increase in insulin concentration, where many studies have indicated that insulin activates NOS by protein kinase B (PKB)-mediated phosphorylation in endothelial cells [34].
Administration of echinochrome improves renal function and ameliorates renal histopathological changes possibly by improvement of glucose metabolism and inhibition of lipid peroxidation process.
Compliance with ethical standards:
No conflict of interested. The authors did not receive any fund for this work.
Research involving animals:
Experimental protocols and procedures used in this study were approved by the Cairo University, Faculty of Science, Institutional Animal Care and Use Committee (IACUC) (Egypt) (CUFS/F/33/14). All the experimental procedures were carried out in accordance with international guidelines for the care and use of laboratory animals.
1. Yao L, Li L, Li X, et al. The anti-inflammatory and antifibrotic effects of Coreopsis tinctoria Nutt on high-glucose-fat diet and streptozotocin-induced diabetic renal damage in rats. BMC Complement Altern Med. 2015;15:314. doi: 10.1186/s12906-015-0826-x
2. Toma A, Makonnen E, Mekonnen Y, et al. Antidiabetic activities of aqueous ethanol and n-butanol fraction of Moringa stenopetala leaves in streptozotocin-induced diabetic rats. BMC Complement Altern Med. 2015;15:242. doi: 10.1186/s12906-015-0779-0
3. Tian W, Lei H, Guan R, et al. Icariside II ameliorates diabetic nephropathy in streptozotocin-induced diabetic rats. Drug Des Devel Ther. 2015;9:5147-5157. doi: 10.2147/DDDT.S90060
4. Tan AL, Forbes JM, Cooper ME. AGE, RAGE, and ROS in diabetic nephropathy. Semin Nephrol. 2007;27(2):130-143. doi: 10.1016/j.semnephrol.2007.01.006
5. Zhang S, Xu H, Yu X, et al. Simvastatin ameliorates low-dose streptozotocin-induced type 2 diabetic nephropathy in an experimental rat model. Int J Clin Exp Med. 2015;8(4):6388-6396.
6. Mitra SK, Gopumadhavan S, Muralidhar TS, et al. Effect of a herbomineral preparation D-400 in streptozotocin-induced diabetic rats. J Ethnopharmacol. 1996;54(1):41-46. doi: 10.1016/0378-8741(96)01439-0
7. Mohamed AS, Soliman AM, Marie MA. Mechanisms of echinochrome potency in modulating diabetic complications in liver. Life Sci. 2016;151:41-49. doi: 10.1016/j.lfs.2016.03.007
8. Amarowicz R, Synowiecki J, Shahidi F. Sephadex LH-20 separation of pigments from shells of red sea urchin (Strongylocentrotus franciscanus). Food Chemistry. 1994;51(2):227-229. doi: 10.1016/0308-8146(94)90262-3
9. Lennikov A, Kitaichi N, Noda K, et al. Amelioration of endotoxin-induced uveitis treated with the sea urchin pigment echinochrome in rats. Mol Vis. 2014;20:171-177.
10. Freund A, Johnson SB, Rosenbloom A, et al. Subjective Symptoms, Blood Glucose Estimation, and Blood Glucose Concentrations in Adolescents With Diabetes. Diabetes Care. 1986;9(3):236-243. doi: 10.2337/diacare.9.3.236
11. Schirmeister J, Man NK, Hallauer W, Gropp H. [Discrepancy in serum urea and creatinine concentrations following acute renal failure]. Dtsch Med Wochenschr. 1969;94(10):482-485. doi: 10.1055/s-0028-1108975
12. Fawcett JK, Scott JE. A Rapid and Precise Method for the Determination of Urea. J Clin Pathol. 1960;13(2):156-159. doi: 10.1136/jcp.13.2.156
13. Barham D, Trinder P. An improved colour reagent for the determination of blood glucose by the oxidase system. The Analyst. 1972;97(1151):142. doi: 10.1039/an9729700142
14. Ohkawa H, Ohishi N, Yagi K. Assay for lipid peroxides in animal tissues by thiobarbituric acid reaction. Anal.Biochem. 1979;95(2):351-358. doi: 10.1016/0003-2697(79)90738-3
15. Beutler E, Duron O, Kelly BM. Improved method for the determination of blood glutathione. J Lab Clin Med. 1963;61:882-888.
16. Montgomery H, Dymock JF. Determination of nitrite in water. The Analyst. 1961;86(102): 414.
17. Habig WH, Pabst MJ, Jakoby WB. Glutathione S-transferases. The first enzymatic step in mercapturic acid formation. J Biol Chem. 1974;249(22):7130-7139.
18. Nishikimi M, Appaji Rao N, Yagi K. The occurrence of superoxide anion in the reaction of reduced phenazine methosulfate and molecular oxygen. Biochem. Bioph. Res. Common. 1972;46(2):849-854. doi: 10.1016/s0006-291x(72)80218-3
19. Aebi H. Catalase in vitro. Methods enzymol. 1984;105:121-126. doi: 10.1016/s0076-6879(84)05016-3
20. Gambaro G, Venturini AP, Noonan DM, et al. Treatment with a glycosaminoglycan formulation ameliorates experimental diabetic nephropathy. Kidney International. 1994;46(3):797-806. doi: 10.1038/ki.1994.335
21. Onarliogu B, Gürsoy E. Renal ultrastructure in experimental diabetes mellitus. Tr J Med Sci. 1990;(14): 409 - 415.
22. Seyer-Hansen K, Hansen J, Gundersen HJG. Renal hypertrophy in experimental diabetes. Diabetologia. 1980;18(6). doi: 10.1007/bf00261707
23. BULUT HE, ONARLIOĞLU B, KALOĞLU C, et al. Effects of experimental diabetes and insulin treatment on rabbit renal morphology: a quantitative and qualitative study. Tr J Med Sci. 2001;31(3):209-216.
24. Maxine M, Benjamin B. Outline of veterinary clinical pathology. Colorado State University Rekha Printers, New Delhi OpenURL. 1985.
25. Arroyo V, Jiménez W. Complications of cirrhosis. II. Renal and circulatory dysfunction. Lights and shadows in an important clinical problem. J Hepatol. 2000;32:157-170. doi: 10.1016/s0168-8278(00)80423-7
26. Bennet J, Braunwald E, Fauci A, et al. Harrison’s principles of internal medicine. Harrison’s Principles of Internal Medicine. 2001.
27. Veeramani C, Pushpavalli G, Pugalendi KV. Antihyperglycaemic effect of Cardiospermum halicacabum Linn. leaf extract on STZ-induced diabetic rats. J Appl Biomed. 2008;6(1):19-26.
28. Onat A, Uyarel H, Hergenc G, et al. Serum uric acid is a determinant of metabolic syndrome in a population-based study. Am J Hypertens. 2006;19(10):1055-1062. doi: 10.1016/j.amjhyper.2006.02.014
29. Baghel M, Modala S, Kumar P, et al. Correlation of creatinine clearance and urine microalbumin in type 2 diabetes mellitus. Int. J. Basic. Appl. Med. Sci. 2014; 4(2):182-186.
30. Fabbrini E, Serafini M, Colic Baric I, et al. Effect of plasma uric acid on antioxidant capacity, oxidative stress, and insulin sensitivity in obese subjects. Diabetes. 2014;63(3):976-981. doi: 10.2337/db13-1396
31. Dave G, Kalia K. Hyperglycemia induced oxidative stress in type-1 and type-2 diabetic patients with and without nephropathy. Cell Mol Biol (Noisy-le-grand). 2007;53(5):68-78.
32. Dellamea B, Leitão C, Friedman R, Canani L. Nitric oxide system and diabetic nephropathy. Diabetology & Metabolic Syndrome. 2014;6(1):17. doi: 10.1186/1758-5996-6-17
33. Takahashi T, Harris RC. Role of endothelial nitric oxide synthase in diabetic nephropathy: lessons from diabetic eNOS knockout mice. J Diabetes Res. 2014;2014:590541. doi: 10.1155/2014/590541
34. Salt IP, Morrow VA, Brandie FM, et al. High glucose inhibits insulin-stimulated nitric oxide production without reducing endothelial nitric-oxide synthase Ser1177 phosphorylation in human aortic endothelial cells. J Biol Chem. 2003;278(21):18791-18797. doi: 10.1074/jbc.M210618200
Soliman A.M., Mohamed A.S., Marie M.S. Echinochrome pigment attenuates diabetic nephropathy in the models of type 1 and type 2 diabetes. Diabetes mellitus. 2016;19(6):464-470. (In Russ.) https://doi.org/10.14341/DM8039
 |
117036, Russian Federation
11, Dmitriya Ul’yanova street, Moscow


