


Contents
Scroll to:
 P. A. Makhnovskii,
N. S. Kurochkina,
T. F. Vepkhvadze,
A. O. Tomilova,
E. M. Lednev,
M. V. Shestakova,
D. V. Popov
P. A. Makhnovskii,
N. S. Kurochkina,
T. F. Vepkhvadze,
A. O. Tomilova,
E. M. Lednev,
M. V. Shestakova,
D. V. Popov https://doi.org/10.14341/DM13166
Scroll to:
BACKGROUND. Skeletal muscles play a key role in the organism’s carbohydrate metabolism. Dysregulation of insulin-dependent glucose uptake in skeletal muscle disrupts carbohydrate metabolism in the organism and can lead to the development of obesity and type 2 diabetes.
AIM. To identify expression markers (genes) of human skeletal muscle associated with disorders of glucose metabolism in the basal state and after a mixed meal normalized for body mass.
MATERIALS AND METHODS. The study involved three groups of 8 people: healthy volunteers, obese patients without and with type 2 diabetes. Venous blood samples were taken in the morning (09:00) after an overnight fast and 30 min, 60 min, 90 min, 120 min, and 180 min after ingestion of a mixed meal normalized by body mass (6 kcal/kg). Biopsy samples from m. vastus lateralis was taken before and 1 h after a meal to assess gene expression (RNA sequencing) and search for genes correlating with markers of impaired glucose metabolism in the basal and postprandial state.
RESULTS. Strong correlations (|ρ|>0.7 and p<0.001) between the gene expression and the level of insulin, C-peptide, glucose or glycated hemoglobin in the basal and/or postprandial state was found for 75 genes. Of these, 17 genes had marked differences (>1.5-fold) in expression between healthy people and patients, or differences in expression changes in response to a meal. We can note genes whose role in impaired glucose metabolism has already been shown earlier (FSTL1, SMOC1, GPCPD1), as well as a number of other genes that are promising for further study of the mechanisms of insulin resistance in skeletal muscle.
CONCLUSION. Skeletal muscle expression markers were identified as promising candidates for future targeted studies aimed at studying the mechanisms of insulin resistance and searching for potential therapeutic targets.
Makhnovskii P.A., Kurochkina N.S., Vepkhvadze T.F., Tomilova A.O., Lednev E.M., Shestakova M.V., Popov D.V. Expression markers of human skeletal muscle associated with disorders of glucose metabolism in the basal and postprandial state. Diabetes mellitus. 2024;27(5):411-421. https://doi.org/10.14341/DM13166
Obesity is one of the main contributors to the development of socially significant chronic metabolic diseases, such as metabolic syndrome and type 2 diabetes mellitus (T2D). In Russia, the number of patients with T2D is growing and today is about 3% of the population [1]. Skeletal muscles play a key role in the carbohydrate metabolism in the body, since even at rest their contribution to insulin-dependent glucose consumption exceeds 80% [2]. This means that dysregulation of insulin-dependent glucose uptake by skeletal muscle impairs carbohydrate metabolism and can lead to obesity and T2D.
The insulin resistance of skeletal muscle is mainly associated with impaired insulin-dependent signaling regulating translocation of glucose transporter GLUT4 and postprandial uptake of glucose from the bloodstream. However, it turned out that in individuals with obesity and T2D, skeletal muscles in a basal state (fasting) have pronounced changes in the phosphorylation of many signaling molecules that are not part of the canonical insulin signaling cascade, as well as a number of transcription factors [3], which is in good agreement with the change in the transcriptional profile of the muscles of patients [4–6]. These changes can be caused by a change in the blood insulin and other hormones and metabolites in the basal state, as well as the sensitivity of skeletal muscles to them. Indeed, a number of studies have found significant correlations of gene expression in fasting skeletal muscle with blood insulin levels and some markers of metabolic disorders. For example, a study of the transcriptome of skeletal muscles in individuals with different body mass index revealed 180 significant correlations of gene expressions with the insulin resistance index (Homeostatic Model Assessment for Insulin Resistance, HOMA IR), including, among other things, some regulators of lipid metabolism and the AKT-mTOR signaling pathway that regulates protein synthesis and proteolysis, gene expression, etc. [7]. In addition, a meta-analysis of transcriptomic data showed that the expression of the insulin receptor gene (INSR) and its substrate (IRS2) negatively correlate with the level of fasting insulin in skeletal muscle of individuals with different levels of insulin sensitivity [8].
On the other hand, a change in basal expression of skeletal muscle genes can be regulated by a change in the content of insulin and other substances caused by regular meals. Indeed, several studies have shown that an increase in blood insulin during clamp testing (up to 100 mU/L or ~0.6 nM) after 3–4 hours alters the expression of several hundred genes in skeletal muscle of healthy individuals [9,10]. In addition, significant associations of gene expression in muscle tissue and adipose tissue with carbohydrate metabolism during insulin stimulation (clamp test) have already been found [11]. However, it must be noted that in healthy individuals and in obese individuals with or without T2D, there might be a significant difference in the increase and absolute level of insulin during everyday meals from those obtained under the clamp test conditions and between themselves. Therefore, a great interest exists in studies examining changes in glucose metabolism and gene expression in skeletal muscle in reaction to meals, normalized by body weight [12–14]
The purpose of the study is to identify expression markers (genes) of human skeletal muscle associated with impaired glucose metabolism in the basal state and after meals, normalized by body weight.
A multicenter interventional prospective comparative study.
The organization of the study was described in our previous publications [15][16]. Studies with patients were carried out at the Endocrinology Research Centre from April 2022 to May 2023. Studies with healthy volunteers were carried out at the Institute of Biomedical Problems, Russian Academy of Sciences, during the period from March 2022 to September 2023.
The characteristics of the volunteers are shown in Table 1. The study included 8 healthy volunteers («H») (inclusion criteria: BMI<25; absence of diagnosed T2D), 8 obese patients («Ob») (BMI>30; absence of diagnosed T2D) and 8 obese patients with T2D (BMI>30; diagnosed T2D). T2D patients were on glucose-lowering therapy; this therapy was interrupted for 1–2 days (sodium glucose cotransporter-2 inhibitors, dipeptidyl peptidase-4 inhibitors, sulfonylurea derivatives, biguanide [metformin]) and/or for 7 days (glucagon-like peptide-1 receptor agonist [semaglutide]) prior to the mixed meal tolerance test.
Table 1. Characteristics of volunteers
|
Male/Female |
Reference |
H |
Ob |
T2D |
|
4/4 |
3/5 |
4/4 |
||
|
Age, years |
41.0 (34.5–46.8) |
40.0 (25.0–51.0) |
58.0*# (48.0–63.5) |
|
|
Body mass index, kg/m² |
18.5–25 |
22.5 (19.4–24.0) |
43.5*** (37.2–50.1) |
39.3** (38.2–45.1) |
|
Glucose, mmol/L |
<6.1 |
4.9 (4.5–5.2) |
5.1 (5.0–5.4) |
6.4** (5.8–9.9) |
|
Insulin, mU/L |
2.6–24.9 |
7.2 (5.7–7.5) |
19.5** (16.3–32.3) |
24.0** (16.4–35.7) |
|
C-peptide, ng/mL |
1.1–4.4 |
2.0 (1.7–2.3) |
3.4* (2.6–5.0) |
4.4** (3.3–6.4) |
|
HbA1c, % |
4.0–6.0 |
5.3 (5.0–5.6) |
5.2 (5.0–5.5) |
6.3*## (5.8–8.3) |
Note: Median and interquartile range are presented; * – difference from control, # – difference from Ob; one, two, and three characters, p≤0,05, ≤0,01, and ≤0,001, respectively.
All volunteers completed a short form survey SF-12 [17] to subjectively assess their physical abilities. Venous blood samples from v. cephalica were taken in the morning on an empty stomach (09:00) and 30 min, 60 min, 90 min, 120 min and 180 min after ingestion of mixed food product Resource 2.0 (Nestle Health Science, France, 3 ml or 6 kcal/kg b.w.; protein : fat : carbohydrate ratio 1:2.3:2.7 kcal/kg b.w.) (Figure 1A). Needle biopsy was taken from the middle of m. vastus lateralis under local anesthesia (2 mL of 2% lidocaine), before and one hour after meals (the second biopsy was taken 10 cm proximal to the first) as described elsewhere [15][16].

Figure 1. Experimental design (A) and flow chart of search for expression markers associated with glucose metabolism parameters (B).
Glycated hemoglobin (HbA1c) in whole blood was determined by high performance liquid chromatography using D10 analyzer (BioRad, USA), serum glucose was determined using Architect c8000 automatic analyzer (Abbott Diagnostics, USA); immunoreactive insulin and C-peptide were determined in serum using Cobas 6000 electrochemiluminescence analyzer (Roche, Switzerland) as described elsewhere [13][14].
The whole-genome RNA sequencing and bioinformatic data processing were performed as described elsewhere [16]. In brief, total RNA was isolated using spin columns (RNeasy Mini Kit, Qiagen, Germany) and its concentration was measured (Qubit 4 fluorometer and Qubit RNA HS Assay Kit (Thermo Scientific, USA). After RNA integrity assessment (RIN>7; capillary electrophoresis on TapeStation 4150 and High Sensitivity RNA ScreenTape Kit, Agilent, Germany), chain-specific libraries were prepared with the NEBNext Ultra II Directional RNA Library Preparation Kit (New England BioLabs, USA) and then sequenced (75 nucleotides from one end, covering about 55 million reads per sample) on NextSeq 550 analyzer (Illumina, USA).
RNA reads were mapped to the human genome (primary assembly GRCh38.p13) using the Hisat2 v.2.2.1 software. The number of uniquely mapped reads for the exons of each gene was calculated using the Rsubread package (R software environment). Genes that changed expression were determined using the DESeq2 method with correction for Benjamin-Hochberg multiple comparison (padj<0.05; R environment), expression level was determined using TPM value (Kallisto software, v0.46.2).
After removal of low-expression genes (TPM<1), correlations between protein-coding gene expression and biochemical parameters were determined using Spearman rank correlation coefficient; only strong relationships were used for further analysis: |ρ|>0.7 and p<0.001 (Figures 1B, 3A).
For biological interpretation and finding correlations between basal gene expression and biochemical parameters only those genes were taken whose expression differed by more than 1.5-fold between healthy volunteers and patients (DESeq2 test, padj<0.05) (Figures 1B, 3B).
For biological interpretation and finding correlations between changes in gene expression after meals and biochemical parameters only those genes were used whose expression changes in response to meals significantly differed by more than 1.5-fold between healthy volunteers and patients (Mann-Whitney test, p<0.05).
Kruskal-Wallis univariate analysis of variance corrected for multiple comparison (Dunn test) at significance level of 0.05 was used to assess differences between samples for biochemical parameters.
Protein classes were determined using the KEGG BRITE database.
The study was carried out in accordance with the Helsinki Declaration and approved by the Biomedical Ethics Committee, Institute of Biomedical Problems, Russian Academy of Sciences (Minutes No. 613 of March 29, 2022) and the Local Ethics Committee of the Endocrinology Research Centre (Minutes No. 4 of February 14, 2022). Written informed consent was obtained from all volunteers.
Obese patients (Ob) and obese patients with diabetes mellitus (T2D) differed from healthy patients (H) by elevated basal insulin and C-peptide levels, obese patients with type 2 diabetes mellitus had elevated glucose and glycated hemoglobin levels (Table 1). As we described earlier [15], the dynamics of biochemical parameters after meal differed between groups. In Ob and T2D groups, there was an increased postprandial level and an increase in the area under the curve (iAUC) of C-peptide and insulin (Figures 2A and B). In contrast to the control group, glucose levels in patients were increased up to the second hour after eating (as expected), whereas iAUC was increased only in the T2D group (Figure 2).
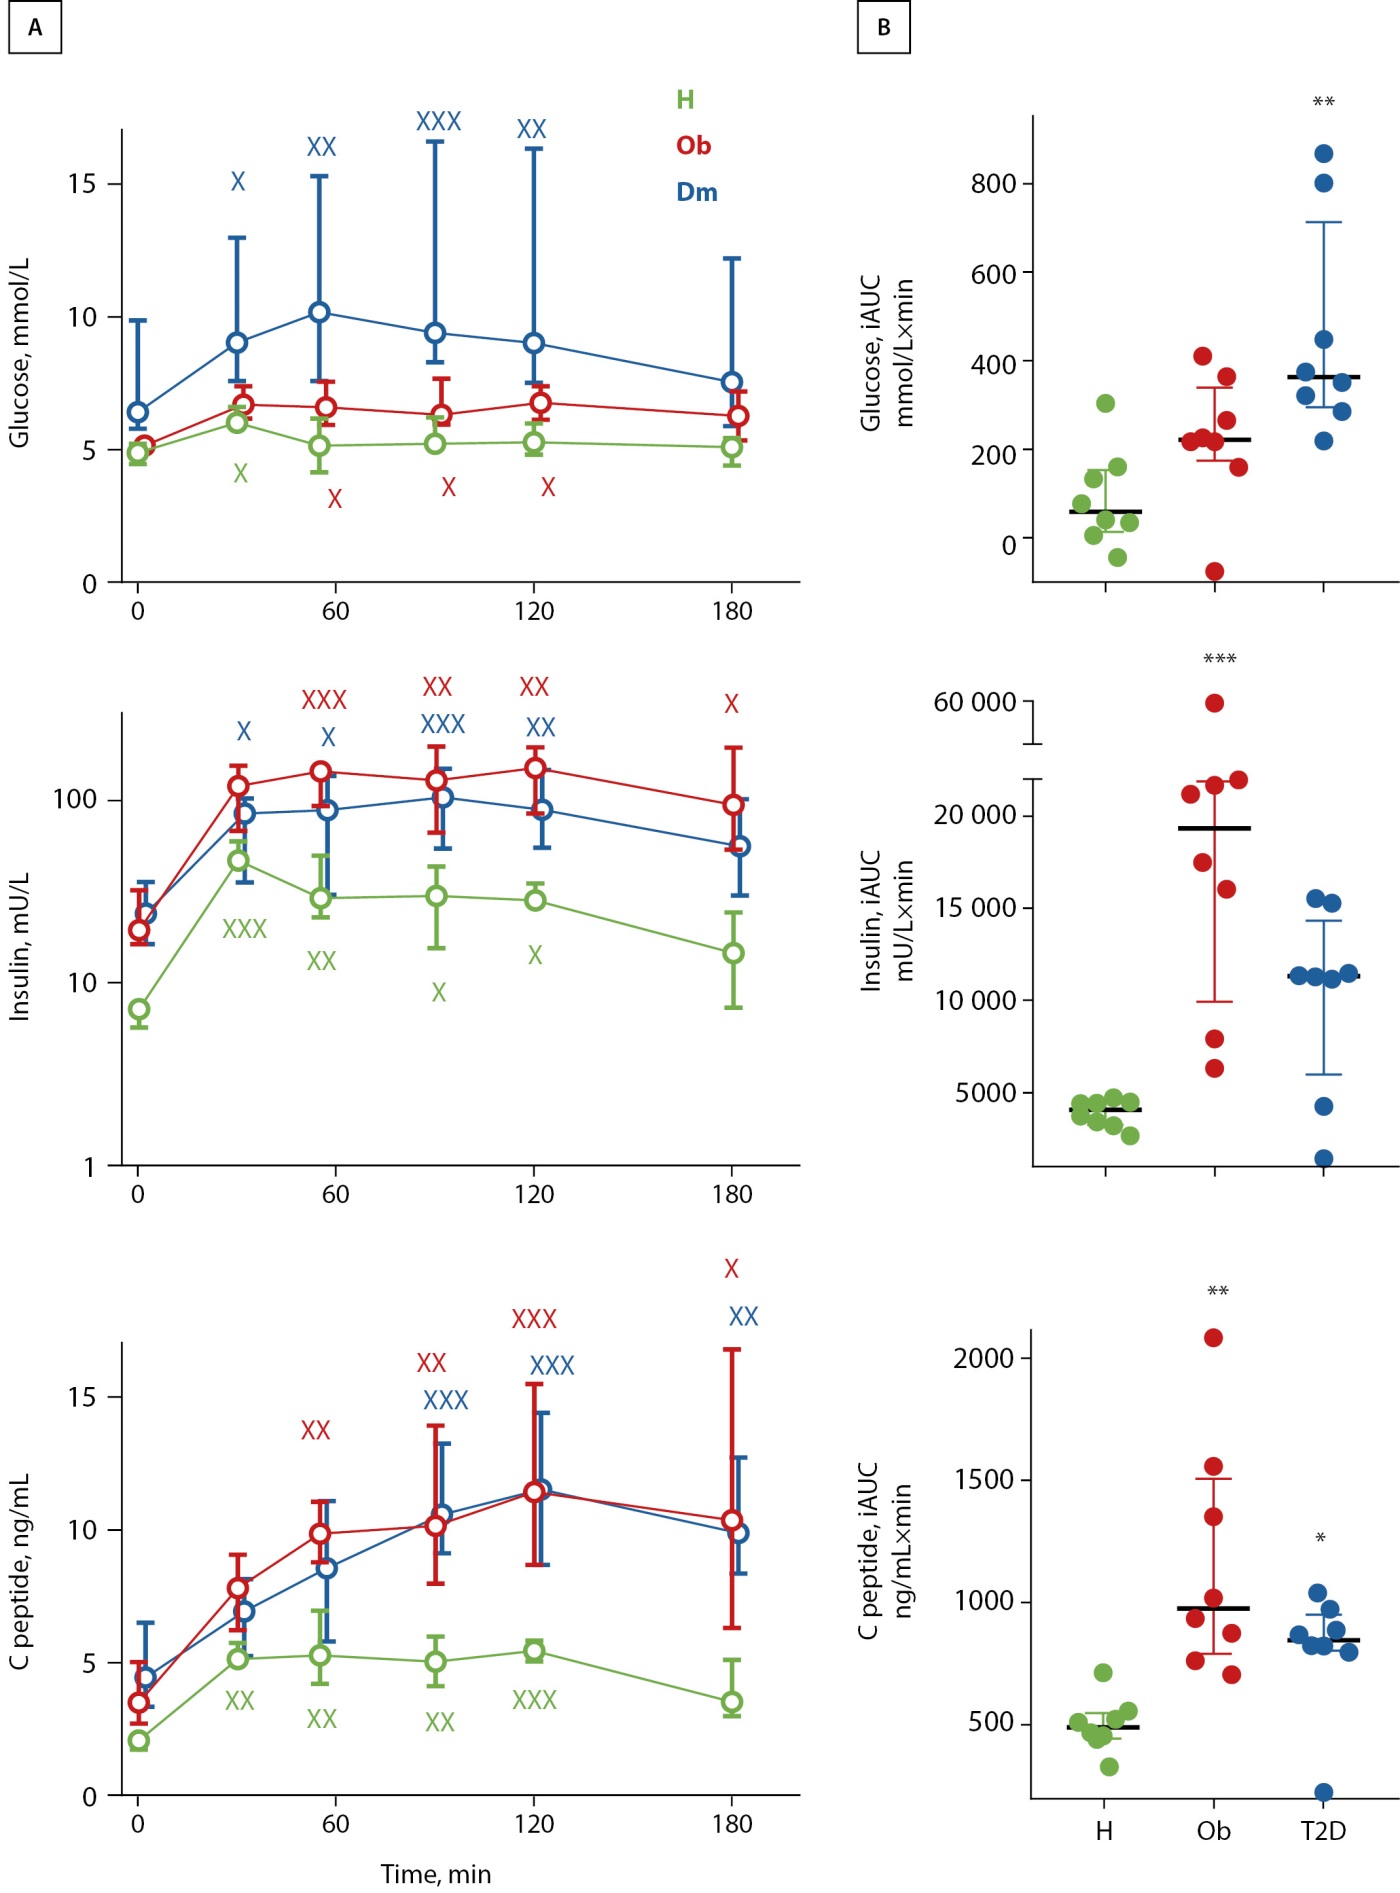
Figure 2. Change in blood glucose, insulin and C-peptide after ingestion of mixed weight-normalized food in healthy subjects (H), obese patients without T2D (Ob) and with T2D (T2D). Trends of these parameters (A) and incremental area under the curve (iAUC) (B) are presented; × – difference from the baseline; * – difference from the control. One, two and three characters – p ≤0,05, ≤0,01 and ≤0,001, respectively.
In the basal state, 526, 174 and 397 genes were found which changed expression compared to healthy controls in the Ob group, T2D group and pooled group of patients, respectively. However, only 38 of these showed significant and strong correlations (|ρ|> 0.7) with basal insulin, C-peptide, fasting glucose, or glycated hemoglobin. In order to identify potential biologically significant correlations, we selected 11 genes, the expression of which differed between the healthy control and any group of patients more than 1.5-fold (Figure 3A, Table 2, supplementary figure). When analyzing the relationship of basal expression with a change in glucose level in response to meal, significant correlations were found for four genes: positive for NFIL3 and VGLL2, and negative for CADM1 and GPCPD1) (Figure 3A, Table 2, supplementary figure).
Table 2. Gene functions with expression differences between groups >1.5 and showing significant strong correlations of basal expression with fasting parameters of glucose metabolism and their postprandial changes.
|
Gene symbol |
Gene name |
Molecular function (Genecards Database) |
Change in expression in patients |
|
CADM1 |
Cell Adhesion Molecule 1 |
Intercellular adhesion regulator |
iT2D, Ob |
|
CPXM2 |
Carboxypeptidase X, M14 Family Member 2 |
Extracellular carboxypeptidase |
hT2D, Ob |
|
FSTL1 |
Follistatin Like 1 |
Secreted glycoprotein involved in a variety of physiological processes |
hT2D, Ob |
|
GPCPD1 |
Glycerophosphocholine Phosphodiesterase 1 |
Glycerophospholipid metabolism enzyme |
iT2D |
|
HCST |
Hematopoietic Cell Signal Transducer |
Phosphoinositide 3-kinase adaptor protein |
hT2D, Ob |
|
MFAP5 |
Microfibril Associated Protein 5 |
Glycoprotein, a component of extracellular matrix microfibrils |
hT2D, Ob |
|
NEK10 |
NIMA Related Kinase 10 |
Kinase, ERK1/ERK2 signaling activator |
iT2D |
|
NFIL3 |
Nuclear Factor, Interleukin 3 Regulated |
Transcription factor |
hT2D |
|
SLC16A10 |
Solute Carrier Family 16 Member 10 |
Thyroid hormone and aromatic amino acid transporter |
hT2D, Ob |
|
SMOC1 |
SPARC Related Modular Calcium Binding 1 |
Secreted protein |
iT2D |
|
SVEP1 |
Sushi, Von Willebrand Factor Type A, EGF And Pentraxin Domain Containing 1 |
Regulator of Ca²⁺ metabolism and vasoconstriction |
hT2D, Ob |
|
TRIM50 |
Tripartite Motif Containing 50 |
E3 ubiquitin transferase |
iT2D |
|
TUBB6 |
Tubulin Beta 6 Class V |
Microtubule cytoskeleton component |
hT2D, Ob |
|
UBTD1 |
Ubiquitin Domain Containing 1 |
Ubiquitin-like protein, may be involved in cellular aging |
hT2D, Ob |
|
VGLL2 |
Vestigial Like Family Member 2 |
Transcriptional cofactor |
hT2D |
Note: Arrows indicate the direction of expression change in obese patients (Ob) and obese patients with type 2 diabetes mellitus (T2D) compared to healthy volunteers.
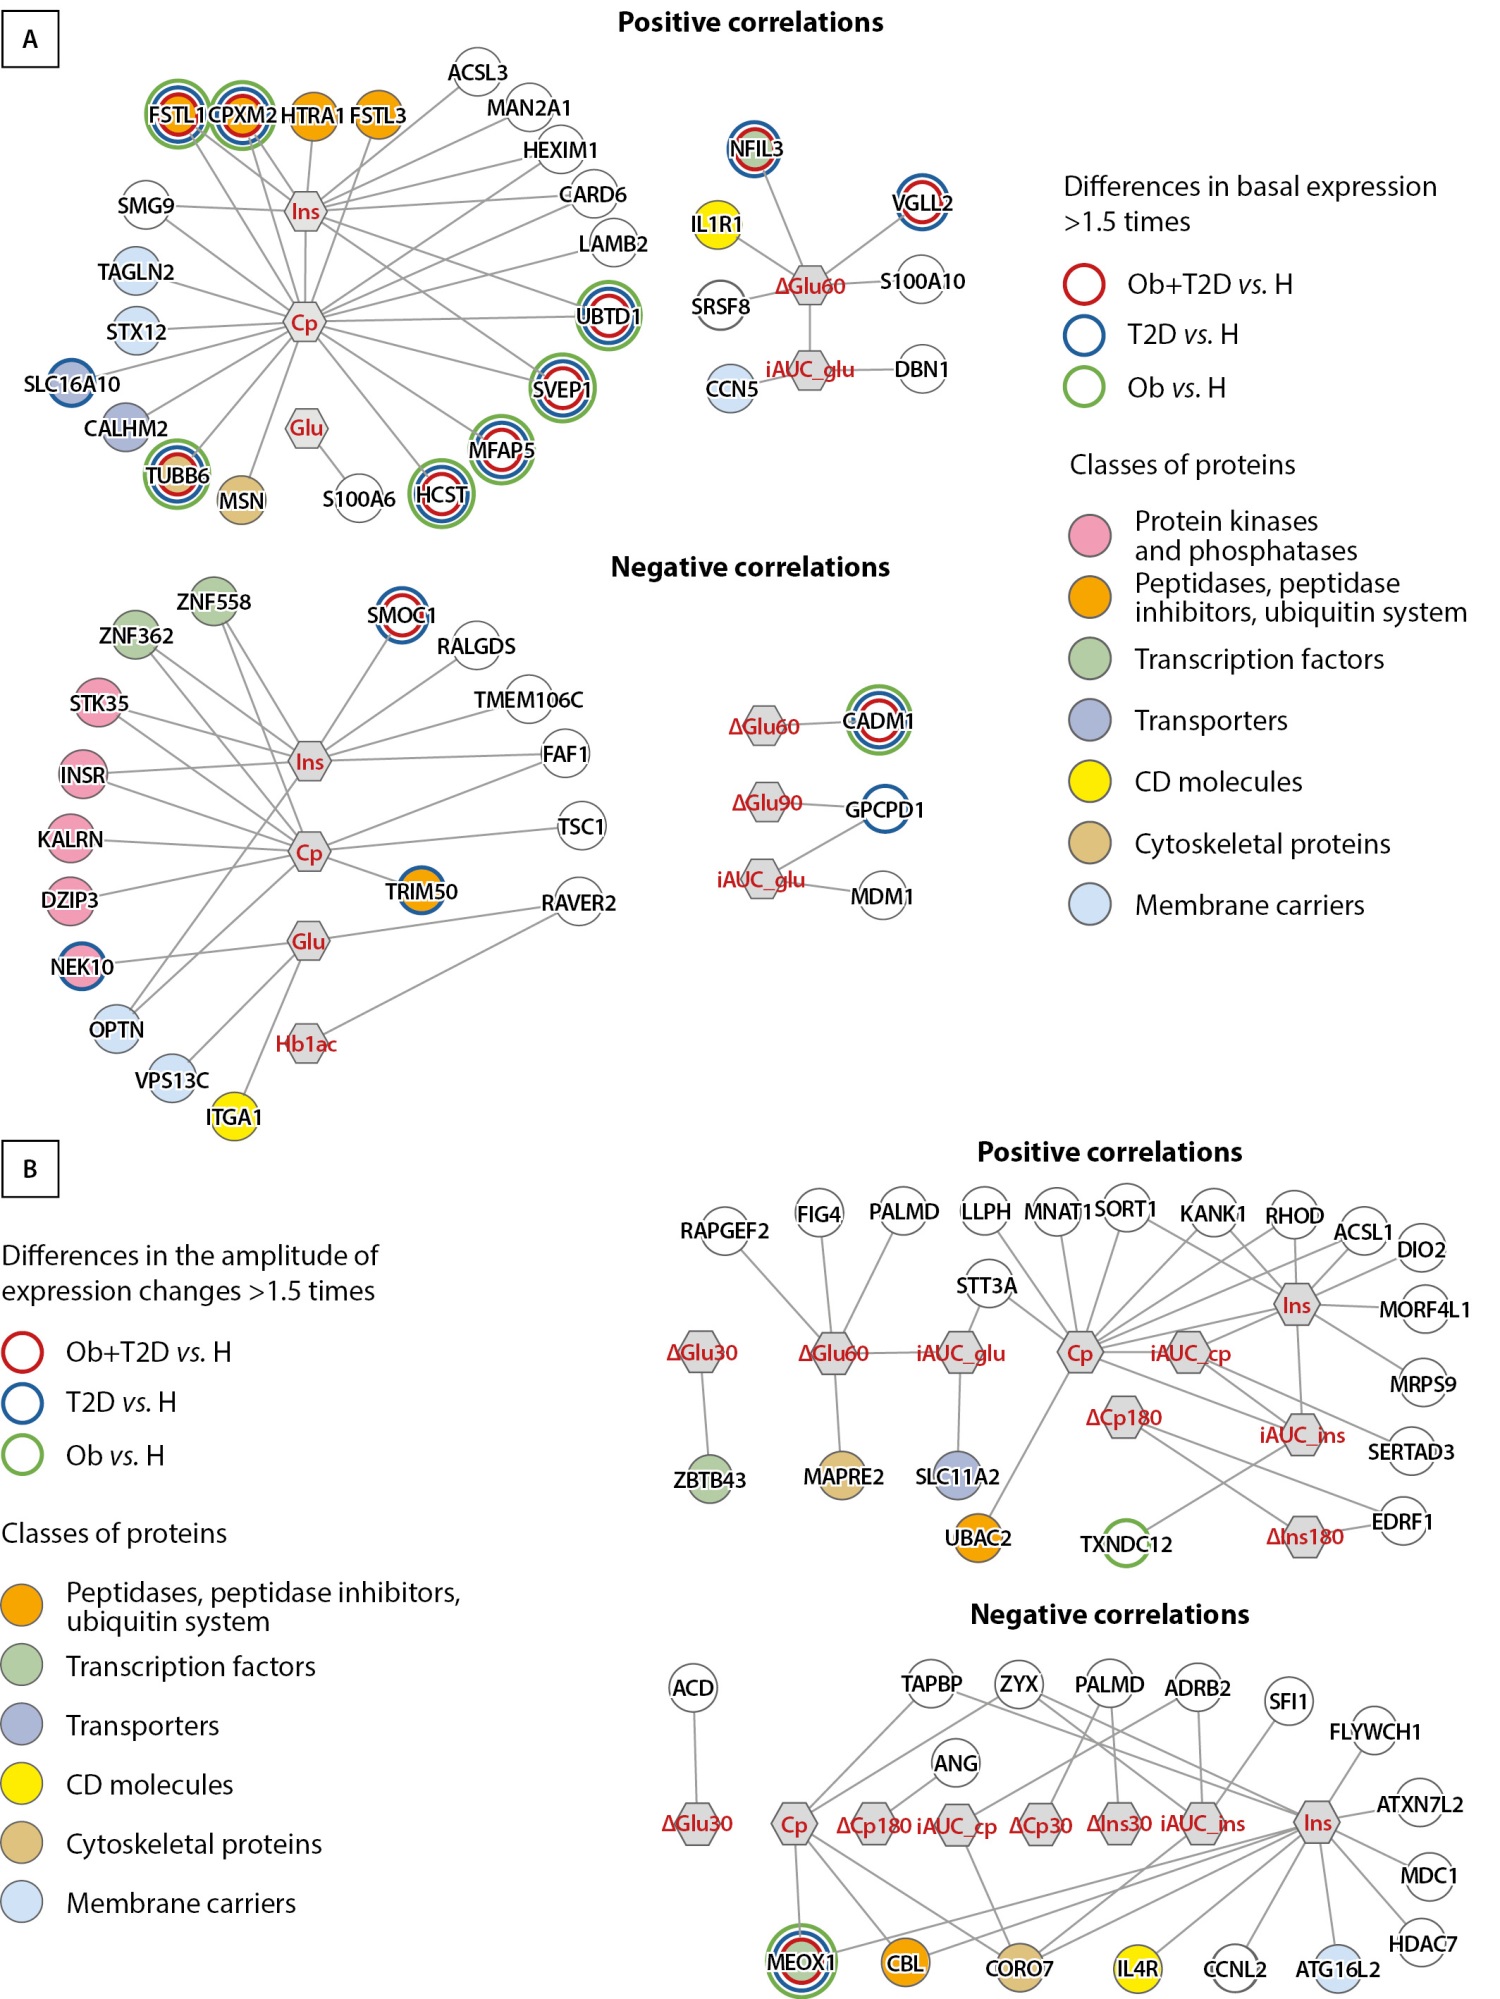
Figure 3. Correlations of basal expression (A) and postprandial skeletal muscle gene expression changes (B) with basal level (morning, fasting) of C-peptide, insulin, and venous blood glucose, and with their postprandial increment. Lines show strong significant correlations (|ρ|>0.7; p<0.001). Colored circles show genes whose basal expression (A) or change in expression (B) in response to food differs between groups by >1.5-fold (green – Ob vs. H, blue T2D vs. H, red – pooled group Ob+T2D vs. H). Circle filling shows the protein class. Ins – insulin, Cp – C-peptide, Glu – glucose, HbA1c – glycated hemoglobin, iAUC – incremental area under the curve of glucose for 180 min after meal, Δ – postprandial changes.
Significant correlations between healthy volunteers and patients were found for 37 genes; among them, only two genes showed a significant (by >1.5) change in the amplitude of postprandial expression – MEOX1 (Mesenchyme Homeobox 1) and TXNDC12 (Thioredoxin Domain Containing 12) (Figure 3B, supplementary figure).
In our study, we examined associations between biochemical parameters of the blood characterizing glucose metabolism abnormalities and gene expression in skeletal muscle in the basal state and after meals in healthy subjects, obese patients without and with T2D. It is important to note that the change in these indicators was studied in nearly physiological conditions, namely after the intake of mixed food normalized by body weight. The study identified 17 genes, the expression of which was associated with metabolic disorders and the level of insulin, C-peptide or glucose (on an empty stomach or in response to a meal) (supplementary figure).
Insulin is an anabolic hormone that regulates many processes in skeletal muscle. In insulin resistance, chronically elevated insulin levels and/or excessive postprandial increments can lead to alterations in insulin-dependent cell signaling and gene expression in skeletal muscle. We identified several expression markers in skeletal muscle that correlate closely with basal levels or postprandial changes in insulin levels. Among them, genes were found for which a role in the regulation of glucose metabolism and the development of metabolic disorders was already demonstrated.
For example, by analogy with our study, which showed that the basal expression of the adipomyokin gene FSTL1 positively correlates with fasting levels of C-peptide and insulin (Figure 4A), the authors of [18] found that the level of FSTL1 in the blood is positively associated with obesity and insulin resistance. On L6 myoblasts and primary dog myoblasts, it was shown that FSTL1, regulates AMPK-dependent glucose uptake and expression of GLUT4 [19]. Moreover, infusion of FSTL1 to dogs with the induced heart failure positively influenced metabolism of fat acids and glucose oxidation [20]. These data and our results suggest that insulin-induced increases in FSTL1 expression in patients may be one of the compensatory mechanisms aimed at prevention of disorders in glucose uptake in muscles.

Figure 4. Examples of correlations between potential expression markers of metabolic disorders (Follistatin like 1, SPARC Related Modular Calcium Bindin 1, Glycerophosphocholine Phosphodiesterase, Adrenoceptor Beta 2 genes) and parameters of glucose metabolism. Healthy volunteers (H) – green, obese patients (Ob) – blue, obese patients with type 2 diabetes mellitus (T2D) – red.
The negative correlations of the expression of the SMOC1 gene with the level of insulin and C-peptide found in our study are consistent with the data on the positive correlation of its protein level in plasma with insulin sensitivity in humans [21]. In mice, intraperitoneal administration of SMOC1 or increased expression of its gene in the liver improved glucose metabolism and insulin sensitivity by increasing the expression of gluconeogenesis regulatory genes [21]. In humans, the relationship between blood SMOC1 levels and carbohydrate metabolism disorders is still unclear, however, our study points to the potential role of changes in this gene expression in skeletal muscle in the development of metabolic disorders.
The UBTD1 and MFAP5 genes had a positive correlation of basal expression with fasting C-peptide levels. This is consistent with other studies where they are described as expression markers positively correlating with fasting glucose level, glucose consumption rate (UBTD1), or degree of obesity or fasting insulin level (MFAP5) [11][22].
Hyperglycemia is a key cause of impaired functioning of various tissues, organs and systems, including skeletal muscles; in particular, its relationship with the development of diabetic myopathy was found [23]. However, the molecular mechanisms of the negative effects of hyperglycemia on skeletal muscle are still poorly understood. We found several expression markers correlated with postprandial glucose levels. For example, basal GPCPD1 expression was negatively correlated with glucose change in response to the mixed meal tolerance test (Figure 4B). The effect of GPCPD1 on the development of insulin resistance in humans has not been studied, but it has been shown in mice that inactivation of this gene in muscles causes glycerophosphocholine accumulation, hyperglycemia and insulin resistance, which is consistent with data on an increase in glycerophosphocholine in skeletal muscle of elderly people and patients with T2D [24].
The role of other genes whose expression was found to be associated with postprandial glucose alteration, has not been studied in relation to the regulation of glucose metabolism in skeletal muscles. However, in primary pancreatic beta cell culture, CADM1 gene expression has been shown to be associated with insulin secretion and glucose level [25], and in primary hepatocyte culture, the NFIL3 gene regulates glucose production and gluconeogenesis [26].
Postprandial changes in the expression of only two genes (transcription factor MEOX1 and endoplasmic reticulum protein TXNC12) correlated with different parameters of glucose metabolism; the role of these genes in regulating glucose metabolism is still unknown. It is worth noting that we included in our analysis only genes with marked differences (>1.5-fold) in postprandial response between patients and healthy individuals. Nevertheless, it is interesting to note the negative correlation between the change in the expression of the beta-2 adrenoceptor gene ADRB2 (1.3-fold difference in expression change between healthy and patients) and the changes in insulin and C-peptide (Figure 4). ADRB2 has been repeatedly associated with insulin resistance and has several polymorphisms reliably associated with obesity [27][28], and its expression positively correlates with fat loss [29].
The results of our study were obtained on a small sample; therefore, subsequent studies are required to verify the markers we found. In addition, the presence of comorbidities, as well as the use of glucose-lowering drugs by patients (despite their withdrawal the day before the study) could affect the variability of the data obtained. In our study, only two patients took exclusively glucose-lowering therapy, the rest additionally took other drugs, mainly for control of arterial hypertension and hypercholesterolemia.
In our study, 17 expression markers (genes) associated with indicators characterizing disorders of glucose metabolism in the basal state and after meals were identified. The validity of our prediction is supported by the fact that for 7 of them, a relationship with metabolic disorders was already demonstrated, and FSTL1 and SMOC1 genes were already considered as potential therapeutic targets for blood glucose control. Other expression markers identified in our study are promising candidates for future targeted studies aimed at investigating the mechanisms of insulin resistance development and may be considered as potential therapeutic targets. In addition, it should be noted that we examined early transcriptome response to mixed food intake; investigating this response at later stages (and looking for associations with impaired glucose metabolism) appears to be a promising area for further research.
Supplementary figure is available at https://zenodo.org/records/10998825
Funding. The study was carried out with the financial support of the Russian Science Foundation as part of Project No. 21-75-10146.
Conflict of interest The authors declare no clear and potential conflicts of interest related to the content of this paper.
Contributions of authors. P.A. Makhnovsky – scientific leadership of the study, bioinformatic and statistical analysis of data and their biological interpretation, writing and editing the manuscript; N.S. Kurochkina – preparation of RNA samples, RNA sequencing, making significant edits to the manuscript; T.F. Vepkhvadze – conducting interventions and their organization, preparation of RNA samples, making significant edits to the manuscript; A.O. Tomilova – work with patients, conducting interventions and their organization, making significant edits to the manuscript; E.M. Lednev – conducting interventions and their organization, statistical analysis of data, making significant edits to the manuscript; M.V. Shestakova – scientific leadership of the study, organization and concept of the study, biological interpretation of the results, making significant edits to the manuscript; D.V. Popov – scientific leadership of the study, organization and concept of the study, biological interpretation of the results, writing the manuscript.
All authors approved the final version of the manuscript before publication, agreed to be responsible for all aspects of the manuscript, ensuring proper investigation and resolution of issues related to the accuracy or fidelity of any part of the manuscript.
Acknowledgments. The authors express their gratitude to I.A. Sclyanik, Cand. Med. Sci. (Diabetes Institute of the Endocrinology Research Centre) for help in working with patients.
1. Dedov I, Shestakova M, Vikulova O, et al. Diabetes mellitus in the Russian Federation: dynamics of epidemiological indicators according to the Federal Register of Diabetes Mellitus for the period 2010–2022. Diabetes mellitus. 2023;26:104-123. (In Russ.) https://doi.org/10.14341/DM13035
2. DeFronzo RA, Ferrannini E, Sato Y, Felig P, Wahren J. Synergistic interaction between exercise and insulin on peripheral glucose uptake. J Clin Invest. Dec. 1981;68(6):1468-74. https://doi.org/10.1172/jci110399
3. Ohman T, Teppo J, Datta N, Makinen S, Varjosalo M, Koistinen HA. Skeletal muscle proteomes reveal downregulation of mitochondrial proteins in transition from prediabetes into type 2 diabetes. iScience. 2021;24(7):102712. https://doi.org/10.1016/j.isci.2021.102712
4. Timmons JA, Atherton PJ, Larsson O, et al. A coding and non-coding transcriptomic perspective on the genomics of human metabolic disease. Nucleic Acids Res. 2018;46(15):7772-7792. https://doi.org/10.1093/nar/gky570
5. Scott LJ, Erdos MR, Huyghe JR, et al. The genetic regulatory signature of type 2 diabetes in human skeletal muscle. Nat Commun. 2016;7:11764. https://doi.org/10.1038/ncomms11764
6. Varemo L, Scheele C, Broholm C, et al. Proteome- and transcriptome-driven reconstruction of the human myocyte metabolic network and its use for identification of markers for diabetes. Cell Rep. 2015;11(6):921-933. https://doi.org/10.1016/j.celrep.2015.04.010
7. Parikh HM, Elgzyri T, Alibegovic A, et al. Relationship between insulin sensitivity and gene expression in human skeletal muscle. BMC Endocr Disord. 2021;21(1):32. https://doi.org/10.1186/s12902-021-00687-9
8. Cen HH, Hussein B, Botezelli JD, et al. Human and mouse muscle transcriptomic analyses identify insulin receptor mRNA downregulation in hyperinsulinemia-associated insulin resistance. FASEB J. 2022;36(1):e22088. https://doi.org/10.1096/fj.202100497RR
9. Coletta DK, Balas B, Chavez AO, et al. Effect of acute physiological hyperinsulinemia on gene expression in human skeletal muscle in vivo. Am J Physiol Endocrinol Metab. 2008;294(5):E910-7. https://doi.org/10.1152/ajpendo.00607.2007
10. Wu X, Wang J, Cui X, et al. The effect of insulin on expression of genes and biochemical pathways in human skeletal muscle. Endocrine. 2007;31(1):5-17. https://doi.org/10.1007/s12020-007-0007-x
11. Lutter D, Sachs S, Walter M, et al. Skeletal muscle and intermuscular adipose tissue gene expression profiling identifies new biomarkers with prognostic significance for insulin resistance progression and intervention response. Diabetologia. May 2023;66(5):873-883. https://doi.org/10.1007/s00125-023-05874-y
12. van Bussel IPG, Fazelzadeh P, Frost GS, Rundle M, Afman LA. Measuring phenotypic flexibility by transcriptome time-course analyses during challenge tests before and after energy restriction. FASEB J. 2019;33(9):10280-10290. https://doi.org/10.1096/fj.201900148R
13. Rijkelijkhuizen JM, Girman CJ, Mari A, et al. Classical and model-based estimates of beta-cell function during a mixed meal vs. an OGTT in a population-based cohort. Diabetes Res Clin Pract. 2009;83(2):280-8. https://doi.org/10.1016/j.diabres.2008.11.017
14. Shankar SS, Vella A, Raymond RH, et al. Standardized Mixed-Meal Tolerance and Arginine Stimulation Tests Provide Reproducible and Complementary Measures of beta-Cell Function: Results From the Foundation for the National Institutes of Health Biomarkers Consortium Investigative Series. Diabetes Care. 2016;39(9):1602-13. https://doi.org/10.2337/dc15-0931
15. Lednev EM, Gavrilova AO, Vepkhvadze TF, et al. Disturbances in Dynamics of Glucose, Insulin, and C-Peptide in Blood after a Normalized Intake of a Mixed Meal in Obesity and Type 2 Diabetes Mellitus. Hum Physiol. 2023;49:668–674. https://doi.org/10.1134/S0362119723600297
16. Makhnovskii PA, Lednev EM, Gavrilova AO, et al. Dysregulation of early gene response to a mixed meal in skeletal muscle in obesity and type 2 diabetes. Physiol Genomics. 2023;55(10):468-477. https://doi.org/10.1152/physiolgenomics.00046.2023
17. Ware JJr, Kosinski M, Keller SD. A 12-Item Short-Form Health Survey: construction of scales and preliminary tests of reliability and validity. Med Care. 1996;34(3):220-33. https://doi.org/10.1097/00005650-199603000-00003
18. Xu X, Zhang T, Mokou M, et al. Follistatin-like 1 as a Novel Adipomyokine Related to Insulin Resistance and Physical Activity. J Clin Endocrinol Metab. 2020;105(12) https://doi.org/10.1210/clinem/dgaa629
19. Lee HJ, Lee JO, Lee YW, Kim SA, Park SH, Kim HS. Kalirin, a GEF for Rac1, plays an important role in FSTL-1-mediated glucose uptake in skeletal muscle cells. Cell Signal. 2017;29:150-157. https://doi.org/10.1016/j.cellsig.2016.10.013
20. Seki M, Powers JC, Maruyama S, et al. Acute and Chronic Increases of Circulating FSTL1 Normalize Energy Substrate Metabolism in Pacing-Induced Heart Failure. Circ Heart Fail. 2018;11(1):e004486. https://doi.org/10.1161/CIRCHEARTFAILURE.117.004486
21. Montgomery MK, Bayliss J, Devereux C, et al. SMOC1 is a glucose-responsive hepatokine and therapeutic target for glycemic control. Sci Transl Med. 2020;12(559). https://doi.org/10.1126/scitranslmed.aaz8048
22. Vaittinen M, Kolehmainen M, Schwab U, Uusitupa M, Pulkkinen L. Microfibrillar-associated protein 5 is linked with markers of obesity-related extracellular matrix remodeling and inflammation. Nutr Diabetes. 2011;1(8):e15. https://doi.org/10.1038/nutd.2011.10
23. Hirata Y, Nomura K, Senga Y, et al. Hyperglycemia induces skeletal muscle atrophy via a WWP1/KLF15 axis. JCI Insight. 2019;4(4) https://doi.org/10.1172/jci.insight.124952
24. Cikes D, Leutner M, Cronin SJF, et al. Gpcpd1-GPC metabolic pathway is dysfunctional in aging and its deficiency severely perturbs glucose metabolism. Nat Aging. 2024;4(1):80-94. https://doi.org/10.1038/s43587-023-00551-6
25. Zhang C, Caldwell TA, Mirbolooki MR, et al. Extracellular CADM1 interactions influence insulin secretion by rat and human islet beta-cells and promote clustering of syntaxin-1. Am J Physiol Endocrinol Metab. 2016;310(11):E874-85. https://doi.org/10.1152/ajpendo.00318.2015
26. Kang G, Han HS, Koo SH. NFIL3 is a negative regulator of hepatic gluconeogenesis. Metabolism. 2017;77:13-22. https://doi.org/10.1016/j.metabol.2017.08.007
27. Saliba LF, Reis RS, Brownson RC, et al. Obesity-related gene ADRB2, ADRB3 and GHRL polymorphisms and the response to a weight loss diet intervention in adult women. Genet Mol Biol. 2014;37(1):15-22. https://doi.org/10.1590/s1415-47572014000100005
28. Mitra SR, Tan PY, Amini F. Association of ADRB2 rs1042713 with Obesity and Obesity-Related Phenotypes and Its Interaction with Dietary Fat in Modulating Glycaemic Indices in Malaysian Adults. J Nutr Metab. 2019;2019:8718795. https://doi.org/10.1155/2019/8718795
29. de Souza ESS, Leite N, Furtado-Alle L, et al. ADRB2 gene influences responsiveness to physical exercise programs: A longitudinal study applied to overweight or obese Brazilian children and adolescents. Gene. 2022;820:146296. doi: https://doi.org/10.1016/j.gene.2022.146296
Pavel A. Mahknovskii - PhD in Biology; RecearcherID: S-7611-2018; Scopus Author ID: 55985671700; eLibrary SPIN: 6720-5905.
76A Khoroshevskoe shosse, 123007 Moscow
none
Nadezhda S. Kurochkina - RecearcherID: JWP-2837-2024; Scopus Author ID: 55887468500.
Moscow
none
Tatiana F. Vepkhvadze - PhD in Biology; RecearcherID: E-3870-2014; Scopus Author ID: 56904245200; eLibrary SPIN: 1411-7760.
Moscow
none
Alina O. Tomilova, MD, PhD student; eLibrary SPIN: 8814-0121.
Moscow
none
Egor M. Lednev - PhD in Medicine; RecearcherID: R-9019-2018; Scopus Author ID: 57192209774; eLibrary SPIN: 5096-2065.
Moscow
none
Marina V. Shestakova - MD, PhD, Professor, Academician of the Russian Academy of Sciences; RecearcherID: HKO-5485-2023; Scopus Author ID: 7004195530; eLibrary SPIN: 7584-7015.
Moscow
none
Daniil V. Popov - PhD in Biology; RecearcherID: E-3913-2014; Scopus Author ID: 25643759400.
Moscow
none
|
|
1. Рисунок 1. Схема эксперимента (А) и поиска экспрессионных маркеров, ассоциированных с показателями обмена глюкозы (Б). | |
| Subject | ||
| Type | Материалы исследования | |
View
(339KB)
|
Indexing metadata ▾ | |
|
|
2. Figure 1. Experimental design (A) and flow chart of search for expression markers associated with glucose metabolism parameters (B). | |
| Subject | ||
| Type | Исследовательские инструменты | |
View
(320KB)
|
Indexing metadata ▾ | |
|
|
3. Рисунок 2. Изменение содержания глюкозы, инсулина и С-пептида в крови после приема смешанной пищи, нормированной на массу тела, у здоровых людей (H), пациентов с ожирением без (Ob) и с СД2 (T2D). Представлена динамика этих показателей (А) и прирост площади под кривой (iAUC) (Б); × — отличие от исходного уровня; * — отличие от контроля. Один, два и три символа — p≤0,05, ≤0,01 и ≤0,001 соответственно. | |
| Subject | ||
| Type | Результаты исследования | |
View
(564KB)
|
Indexing metadata ▾ | |
|
|
4. Figure 2. Change in blood glucose, insulin and C-peptide after ingestion of mixed weight-normalized food in healthy subjects (H), obese patients without T2D (Ob) and with T2D (T2D). Trends of these parameters (A) and incremental area under the curve (iAUC) (B) are presented; × – difference from the baseline; * – difference from the control. One, two and three characters – p ≤0,05, ≤0,01 and ≤0,001, respectively. | |
| Subject | ||
| Type | Исследовательские инструменты | |
View
(561KB)
|
Indexing metadata ▾ | |
|
|
5. Рисунок 3. Корреляции базальной экспрессии (А) и изменений экспрессии генов в скелетной мышце после приема пищи (Б) с базальным уровнем (утром натощак) С-пептида, инсулина и глюкозы в венозной крови, а также с их приростом после приема пищи. Линиями обозначены сильные значимые корреляции (|ρ|>0,7; p<0,001). Цветные круги показывают гены, базальная экспрессия (А) или изменение экспрессии (Б) которых в ответ на прием пищи различается между группами >1,5 раза (зеленый — Ob vs. H, синий T2D vs. H, красный — объединенная группа Ob + T2D vs. H). Заливка круга показывает класс белка. | |
| Subject | ||
| Type | Результаты исследования | |
View
(872KB)
|
Indexing metadata ▾ | |
|
|
6. Figure 3. Correlations of basal expression (A) and postprandial skeletal muscle gene expression changes (B) with basal level (morning, fasting) of C-peptide, insulin, and venous blood glucose, and with their postprandial increment. Lines show strong significant correlations (|ρ|>0.7; p<0.001). Colored circles show genes whose basal expression (A) or change in expression (B) in response to food differs between groups by >1.5-fold (green – Ob vs. H, blue T2D vs. H, red – pooled group Ob+T2D vs. H). Circle filling shows the protein class. | |
| Subject | ||
| Type | Исследовательские инструменты | |
View
(871KB)
|
Indexing metadata ▾ | |
|
|
7. Рисунок 4. Примеры корреляций между потенциальными экспрессионными маркерами метаболических нарушений (гены Follistatin like 1, SPARC Related Modular Calcium Binding 1, Glycerophosphocholine Phosphodiesterase, Adrenoceptor Beta 2) и показателями метаболизма глюкозы. Здоровые добровольцы (H) — зеленый, пациенты с ожирением (Ob) — синий, пациенты с ожирением и сахарным диабетом 2 типа (T2D) — красный. | |
| Subject | ||
| Type | Анализ данных | |
View
(311KB)
|
Indexing metadata ▾ | |
|
|
8. Figure 4. Examples of correlations between potential expression markers of metabolic disorders (Follistatin like 1, SPARC Related Modular Calcium Bindin 1, Glycerophosphocholine Phosphodiesterase, Adrenoceptor Beta 2 genes) and parameters of glucose metabolism. Healthy volunteers (H) – green, obese patients (Ob) – blue, obese patients with type 2 diabetes mellitus (T2D) – red. | |
| Subject | ||
| Type | Исследовательские инструменты | |
View
(312KB)
|
Indexing metadata ▾ | |
Makhnovskii P.A., Kurochkina N.S., Vepkhvadze T.F., Tomilova A.O., Lednev E.M., Shestakova M.V., Popov D.V. Expression markers of human skeletal muscle associated with disorders of glucose metabolism in the basal and postprandial state. Diabetes mellitus. 2024;27(5):411-421. https://doi.org/10.14341/DM13166

 |
117036, Russian Federation
11, Dmitriya Ul’yanova street, Moscow


